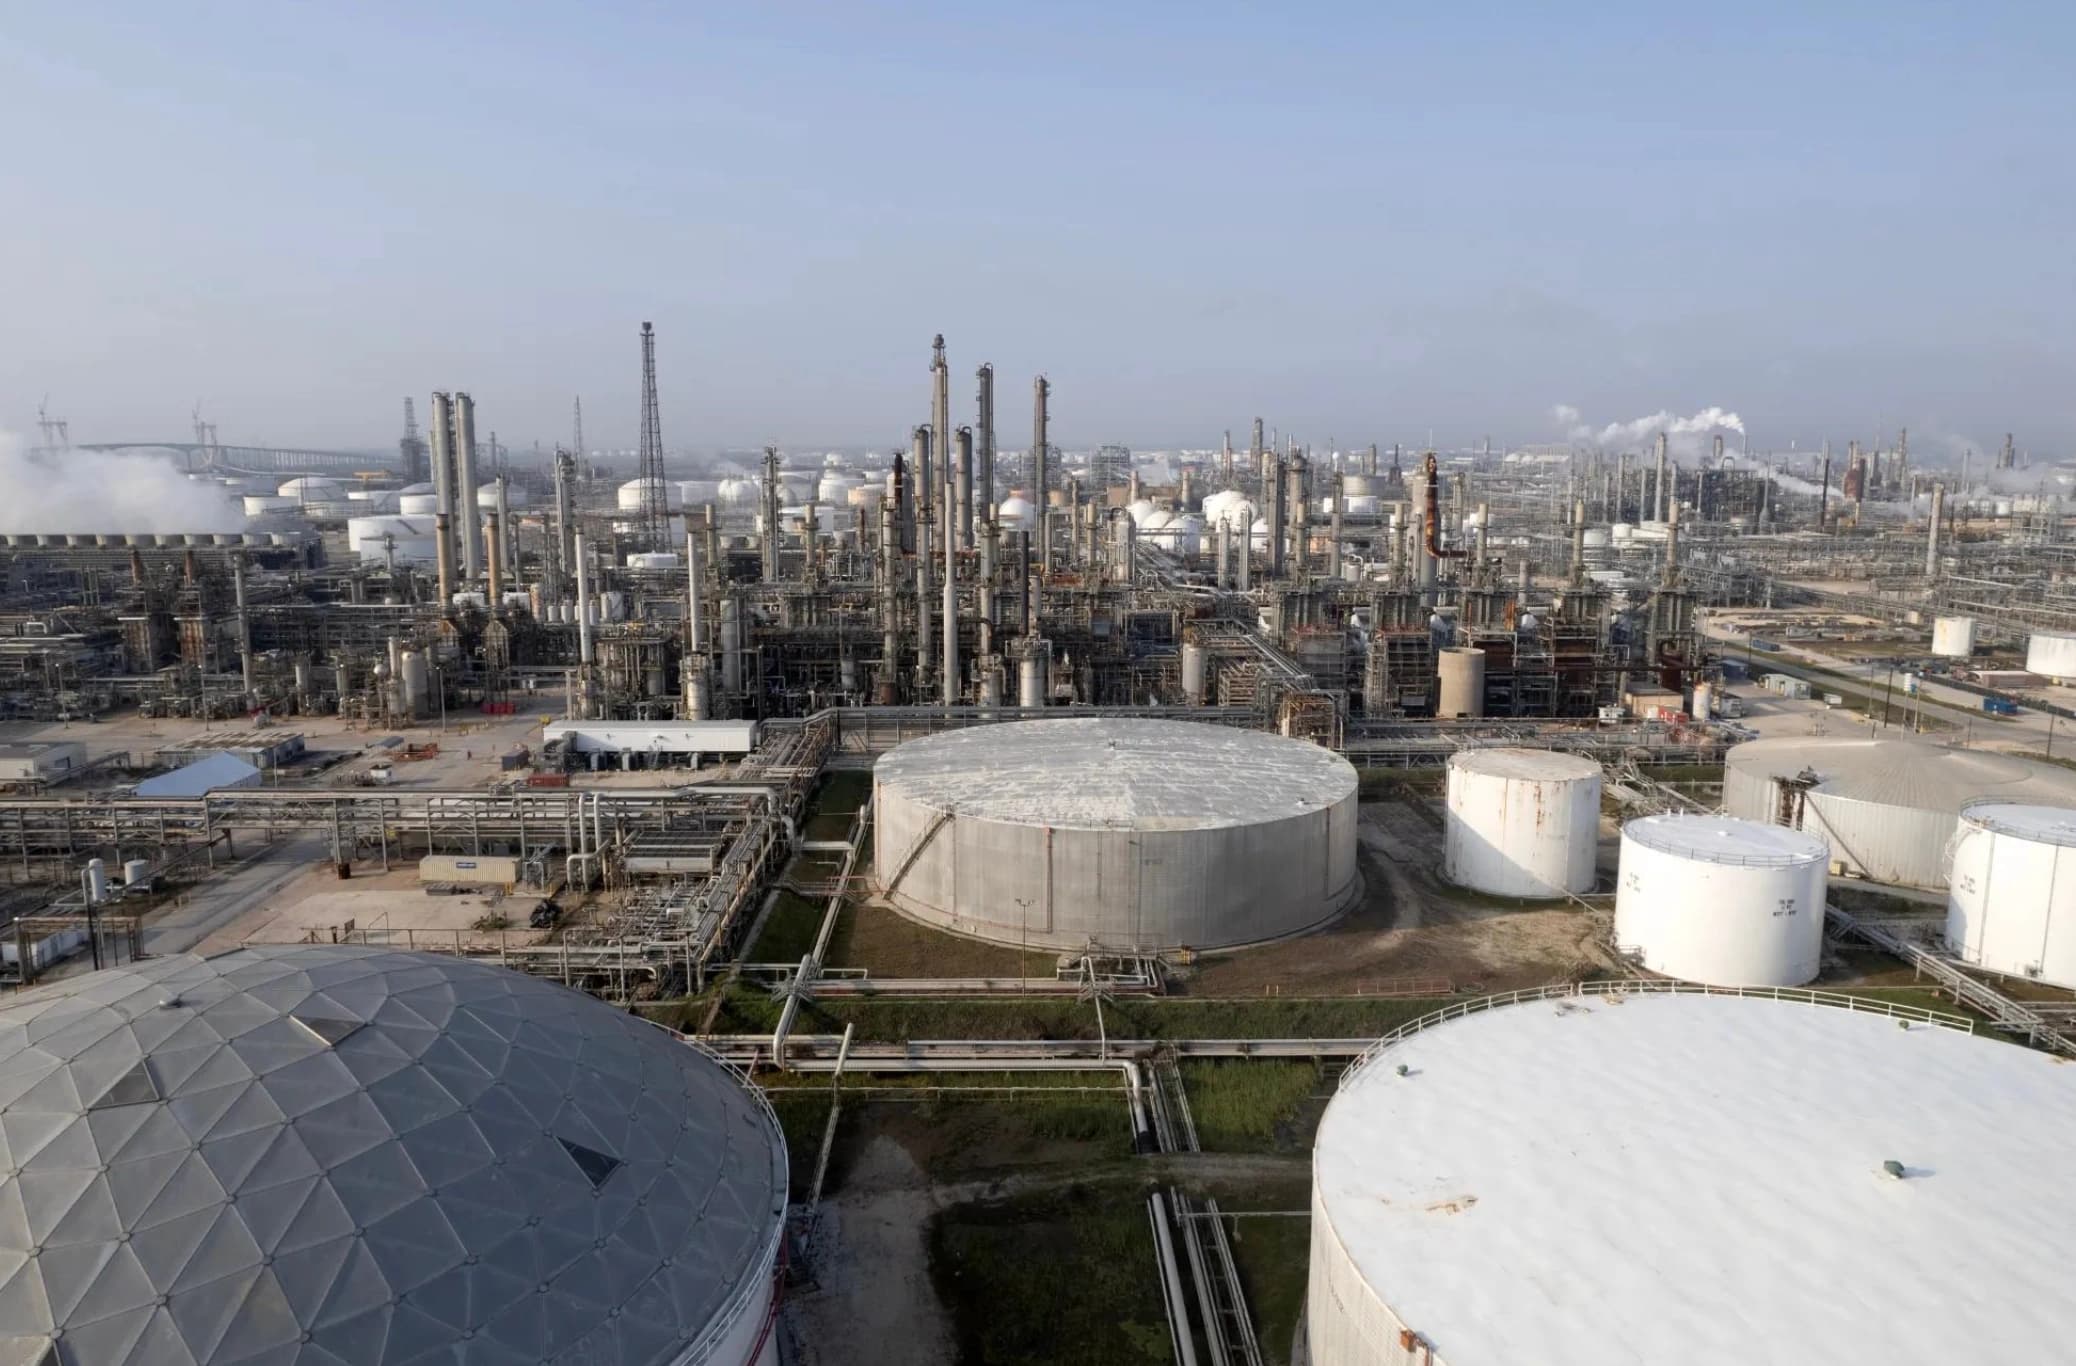

Oil ETFs Crash 8% While Gold and Staples Surge
USO dropped 8.07% and BNO fell 8.64% on November 5 as GLD surged 3.68% and XLP jumped 3.66% — the sharpest single-day sector rotation of Q4 2026.
Key Points
- USO fell 8.07% and BNO collapsed 8.64% on November 5, while GLD surged 3.68% and XLP jumped 3.66% — a 12-point spread between the day's biggest commodity loser and winner.
- Energy sector implied volatility rank hit the 93rd percentile, with ConocoPhillips options pricing at the 100th percentile on its earnings day, signaling the options market is not done pricing in energy sector pain.
- With XLE still up 50.41% year-to-date, the question is whether today's violent single-session unwind is a tactical flush or the start of a multi-week mean reversion in the year's best-performing sector.
USO dropped 8.07% and Brent crude's BNO fell 8.64% on Wednesday while GLD gained 3.68% and consumer staples fund XLP surged 3.66% — a rotation so clean and so sharp it reads less like a market and more like a text-book macro trade executed in real time. The broad indices held green: SPY gained 1.65%, DIA surged 3.10%, QQQ added 0.97%, and IWM advanced 1.51%. The energy carnage was not about the market. It was about oil.
The Oil Flush and What's Still Inside It
An 8%-plus decline in a commodity ETF in a single session is not a routine pullback — it is the kind of move that wipes out weeks of carry and forces systematic funds to delever. USO closed the session at an implied loss sufficient to trigger stop-losses across trend-following strategies that had been riding XLE's 50.41% year-to-date run. BNO's 8.64% decline was sharper still, reflecting Brent crude's more acute sensitivity to whatever supply-side catalyst drove Wednesday's move.
The energy sector SPDR, XLE, fell 4.74% on the session, dragged down across the integrated majors and E&P names. The industrials fund XLI dropped 1.77%, with Caterpillar shedding 5.83% and RTX Corp down 3.64% — collateral damage from an oil-linked industrial complex that had been pricing in sustained energy demand. The semiconductor fund lost 2.75%. Technology's XLK closed at a nearly flat +0.09%, which in the context of a session where DIA gained 3.10% counts as underperformance.
The critical number for forward positioning is not today's spot decline — it is the implied volatility rank on energy. XLE's IV rank sits at 77.6, which places it in the 93rd percentile relative to its own history. ConocoPhillips, reporting earnings today, is priced at the 100th percentile of its own vol range. That is the options market's clearest possible statement: the derivatives complex is not treating today's move as a completed event. It is pricing in a continued distribution of outcomes skewed toward more volatility — and potentially more downside.
Gold, Staples, and the Shape of the Rotation
The flip side of the oil trade is the gold and staples surge, and their simultaneous strength on the same session tells a specific macro story. GLD closed at $372.49, up 3.68% — a large single-day move for a fund that typically grinds in fractions. SLV added $47.16. Consumer staples fund XLP surged 3.66%, with PepsiCo rising 4.80%, Walmart gaining 4.17%, and Procter & Gamble adding 3.41%. Financials' XLF added 2.55%. Real estate's XLRE advanced 2.20%, and health care's XLV gained 1.95%.
This is a recognizable pattern: capital exiting energy and moving simultaneously into defensive consumption names, real assets like gold, and rate-sensitive sectors like real estate. The dollar ETF UUP fell 0.38% to $28.90, which supports gold's move — a weaker dollar is mechanical fuel for commodity-priced-in-dollar assets. The combination of a falling dollar, surging gold, and collapsing oil is not random; it reflects a macro read in which the market is pricing some combination of slower global growth expectations, a supply-side oil shock, or a shift in geopolitical risk premium.
The financials performance adds texture. XLF's 2.55% gain on a day when energy imploded suggests the market is not in full risk-off mode — banks rallied, which typically requires some expectation of sustained economic activity and a rate environment that supports net interest margin. The DIA's 3.10% surge, which outperformed QQQ's 0.97% gain by more than 2 full percentage points, reflects the Dow's heavier weighting toward industrial and financial names rather than mega-cap tech — a bifurcation that matters for index-level ETF positioning. QQQ priced at $691.95, DIA at $533.11, and IWM at $284.02 at the close.
The YTD Setup and What Breaks the Energy Trade
The year-to-date sector scoreboard is worth anchoring here because it frames the stakes of today's move. XLE leads all SPDR sector ETFs at +50.41% for 2026. That is not a modest outperformance — it is a dominant, sustained run that has attracted momentum capital, systematic allocations, and retail positioning over the course of months. Single-day 4.74% declines in a fund with that kind of YTD gain create a specific psychological dynamic: long-term holders are still deeply profitable and unlikely to panic-exit, while short-term momentum players who entered in Q3 may be near their stop levels after Wednesday's session.
XLK sits at +23.04% YTD with $127.3B in AUM, which makes it the largest sector fund by assets. XLC trails the entire sector complex at -14.83% YTD — a remarkable divergence in a year where technology broadly outperformed. The worst-performing sector year-to-date giving up another 4.74% today is a different risk profile than a sector already up 50% correcting sharply.
The AllianceBernstein launch of the AB Equity Premium Income ETF INK — a covered call overlay fund targeting S&P 500 income — is worth flagging in this context. When sector volatility spikes and covered call premiums expand, income-oriented equity strategies with options overlays become more attractive by design. Wednesday's volatility spike across energy and semiconductors directly inflates the premium available to covered call writers, making INK's timing relevant to a session like today's.
For traders watching the energy trade into next week, the specific levels that matter are the November 10 EIA crude inventory report and ConocoPhillips' post-earnings analyst commentary, which will serve as a de facto sector read. If ConocoPhillips guides down on oil price assumptions while inventory data shows a build, the second leg lower in USO becomes the base case. XLE at +50.41% YTD has runway for a 10-to-15% mean reversion without breaking its longer-term structural uptrend — and Wednesday opened the door.
The Weekly Investor
Daily market analysis for active traders. Free.